AutoTrendLines is an indicator for MT4 that spots the most exact trend lines and automatically plots them on the chart.
If you often rely on trend lines in your daily trading, the given indicator will make it much easier to work with them and relieve you of the need to spot and manually draw the lines every time.
The indicator displays only the most actual trend lines. Thus, the line will be removed from the chart if its interaction with the price is no longer expected.
The indicator doesn’t redraw, but it can change the angle of the lines when new extremes occur. It is best suited for intraday and mid-term Forex trading.
The optimal timeframes to work with are M15-H1.
For whom is the indicator suitable?
The trend lines (TL) is a basic analysis tool, so it’s compatible with any indicator and trading system.
If you’re a novice trader, this indicator will help you understand what a trend line is. Besides, while watching the work of the indicator in progress, you’ll learn how to draw trend lines on your own.
Below you can find the techniques that will help you to learn how to analyze trend lines and use them in practice.
For experienced traders, the indicator will suggest trend line options and also save a lot of time while setting them.
Drawing Trend Lines Technique
At first, the indicator tries to locate all possible trend lines on the chart. Then, using a few rough filters, it will exclude more than half of the lines found. Next, it checks the quality of the remaining ones and displays the two best trend lines on the graph.
Thus, there can only be two lines on the chart at the same time:
- Uptrend line (blue);
- Downtrend line (orange).
Trend Projection
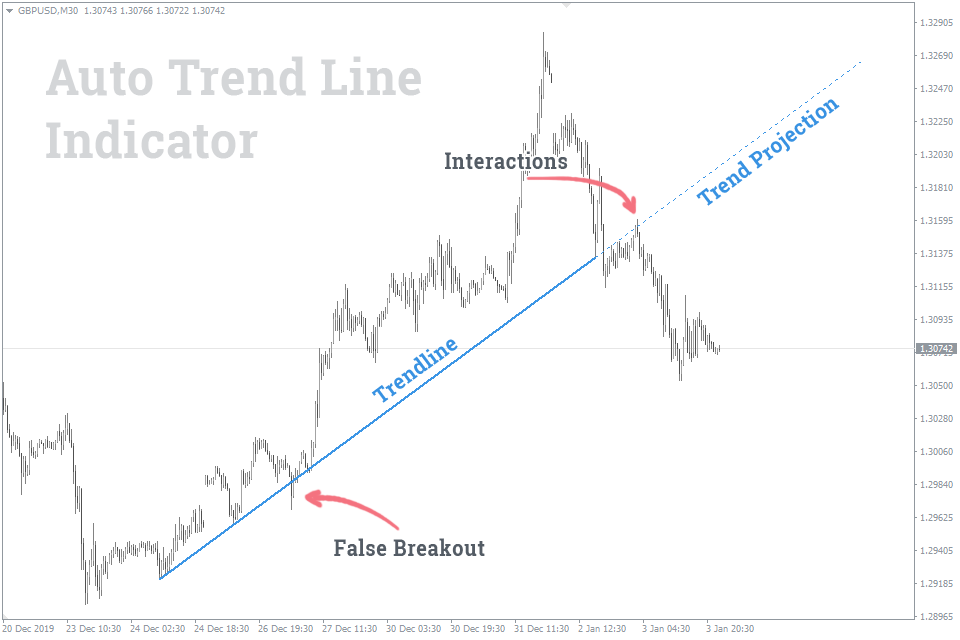
After you install the indicator, you will see that trend lines consist of two kinds of lines: solid and dotted ones.
The solid line is the trend line that the indicator was able to determine.
The dotted one is the suggested direction of the trend continuation, as well as the area of potential interactions between the price and trend line.

As you can see from the picture above, the indicator perfectly identifies true and false breakouts.
How to trade using the Trendlines Indicator?
Most techniques of trading with trend lines can be classified into two main groups:
- Price bounce (reversal) from trend line;
- Trend line breakout.
Rarely, trend lines are used as the price movement vector.
Price bounce from TL
You must have heard quite often the opinion that trading with the trend is the most successful. This is explained by the fact that the asset price tends to continue the trend movement, while a reversal is less likely.
Based on the logic above, it’s best to open a trade next time, when the price touches the trend line. By doing so, added to a potentially profitable trade, you'll also get the optimal reward risk ratio.
Thus, the strategy of “Price bounce from TL" implies:
- Buy if the price has approached or touched the uptrend line;
- Sell if the price has approached or touched the downtrend line.

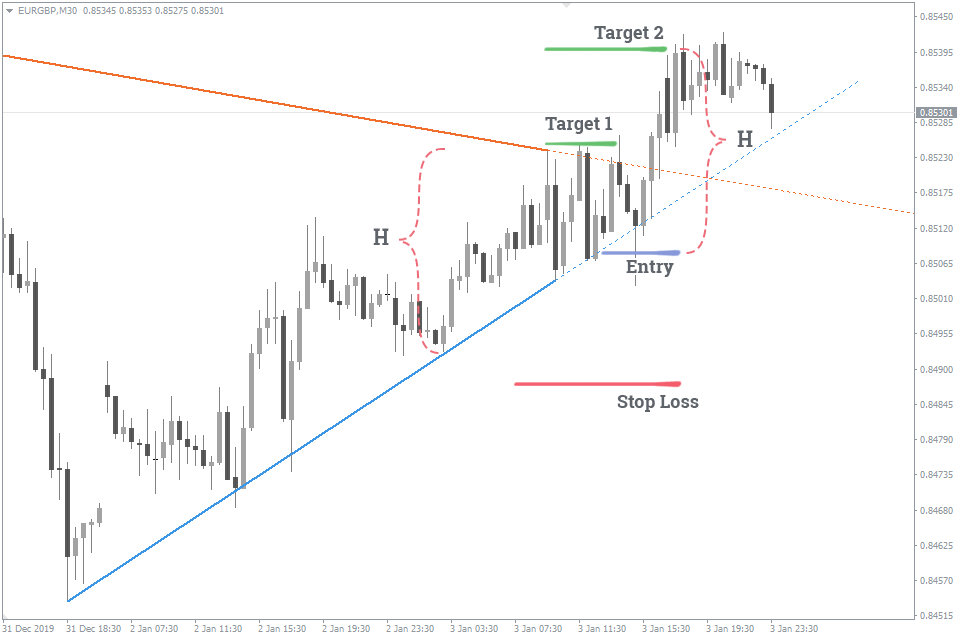
Let's describe the logic behind placing Stop Loss orders using the example of the market situation shown in the picture above:
- It’s recommended to place Stop Loss order under the previous low by a sufficient number of points so that it’s not triggered by a false breakout.
- Take Profit can be placed at the highest price level within the range of the corresponding trend line (TP1), or the distance equaling the height of the previous wave (TP2).
Sell trades have the opposite logic.
We have told you before how to properly place Stop Loss and Take Profit orders regardless of the chosen strategy.
TL breakout
Eventually, all trend lines will break. However, traders don’t miss the opportunity to profit even in this case. That's why there is a strategy of how to trade when the trend line breaks out.
Market entry conditions:
- If the downtrend line has been broken, and the price has settled above it, you should consider buying if the price also touches the line again from the other side.
- If the uptrend line has been broken, and the price has settled below it, you should consider selling if the price also touches the line again from the other side.

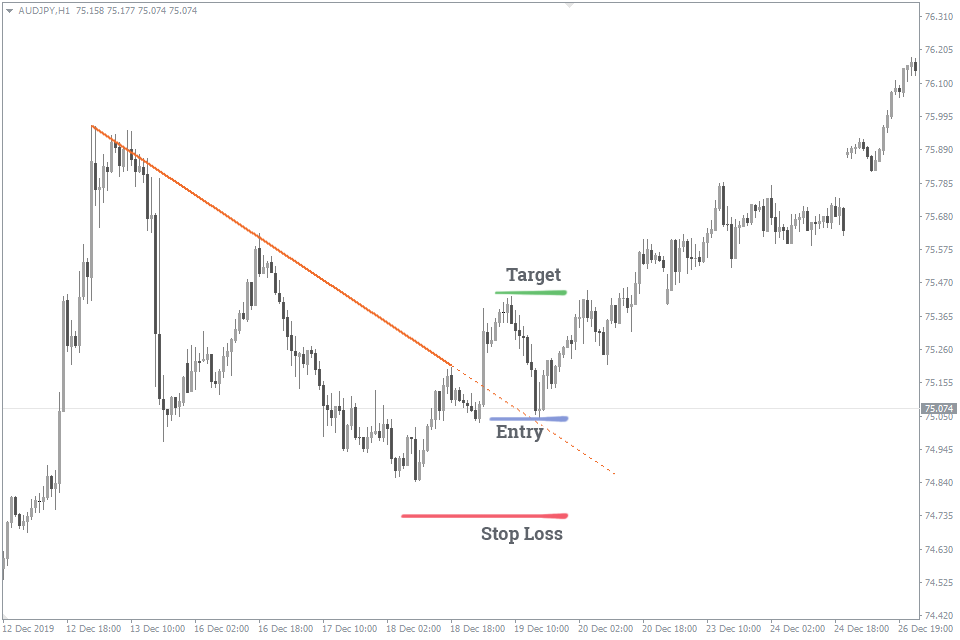
The logic behind placing Stop Loss orders is similar for both strategies. Let's consider it using the example of Buy trade:
- Stop Loss order should be placed below the lowest price level within the range of the considered trend line.
- Take Profit order should be placed at the level of the highest price reached at the time of the trend line breakout.
Similarly, the opposite logic can be applied to Sell trades.
The Indicator Settings
Due to a successful algorithm, trend lines are spotted quite accurately. Therefore, we have added only one option – the depth of the analyzed price history.
Trend Period:
- Short – 300 candles;
- Mid – 600 candles;
- Long – 1200 candles.
The lines color is set automatically depending on the background color of your chart.
Projection length – the length of the predicted trend line in bars.
How to add AutoTrendLines in MT4
Follow the instructions below to install the Indicator to your MT4 terminal:
- Download the ZIP-archive with AutoTrendLines indicator file by clicking the link at the top of the page;
- Unzip the file into the MQL4/indicators folder of your terminal;
- Restart the MT4 terminal;
- Run the indicator by double clicking the indicator name in the MT4 Navigator;
- Check the “Allow DLL imports” box and click “OK“;
- The indicator will be displayed on the chart;
- Adjust the indicator’s settings according to your needs: press CTRL+I, select the indicator from the list, and switch to the “Inputs” tab.


0 Comments